Analysing the Election: Is Twitter biased towards Labour?

In true Aiimi tradition, this year we once again spun up a Twitter analytics platform to follow the UK General Election last week. We wanted to see what the conversation share looked like for each of the parties across Twitter. Which of the major parties was getting the most noise?
The objective was to set up something broadly similar to the one we used back in 2017. However, this year, we had the added bonus of being able to use our own InsightMaker platform to give us a helping hand. In this blog, I’m going to take you through the process we used – from ingestion, through to enrichment, modeling and finally to insights.
Ingestion – Taking in tweets
Fortunately, InsightMaker is a scalable platform designed for storing and serving unstructured content in high volumes – it served as an ideal location to log the millions of election-related tweets.
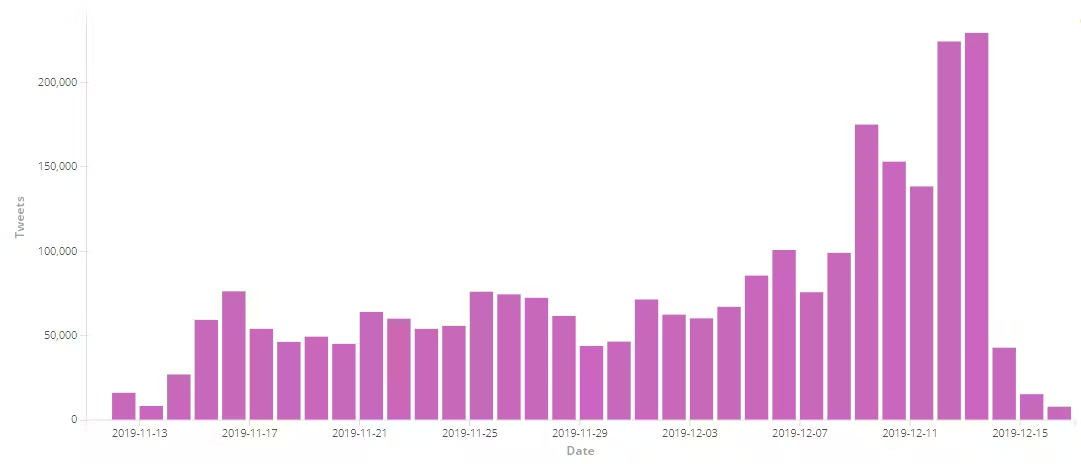
Technically, this involved writing a new crawling function for InsightMaker which hooks into the Twitter Streaming API. We set this running around the start of November and have ingested 2.5 million tweets to-date.
The graph below shows just how many tweets InsightMaker has ingested over this period:
Once the tweets are ingested, InsightMaker’s enrichment engine is ideal for processing their raw content to extract every last drop of information. The enrichment techniques we use fall broadly into two categories: entity extraction and modelling.
Entity Extraction – Assigning tweets to parties
Whilst the idea of simply pulling out interesting entities mentioned in a document may seem a simple one, the actual story can be much more complicated! There are three different methods which are commonly used, all with different levels of complexity. If you do want to find out more about these methods, check out this recent blog from our CTO Paul – Structuring the Unstructured with Business Entity Extraction.
As you may expect, the simplest method is simply looking for a matching word or phrase from a dictionary. After compiling a list of political parties, their leaders, synonyms and twitter handles, implementing party entity extraction using this method is both very easy and very effective.
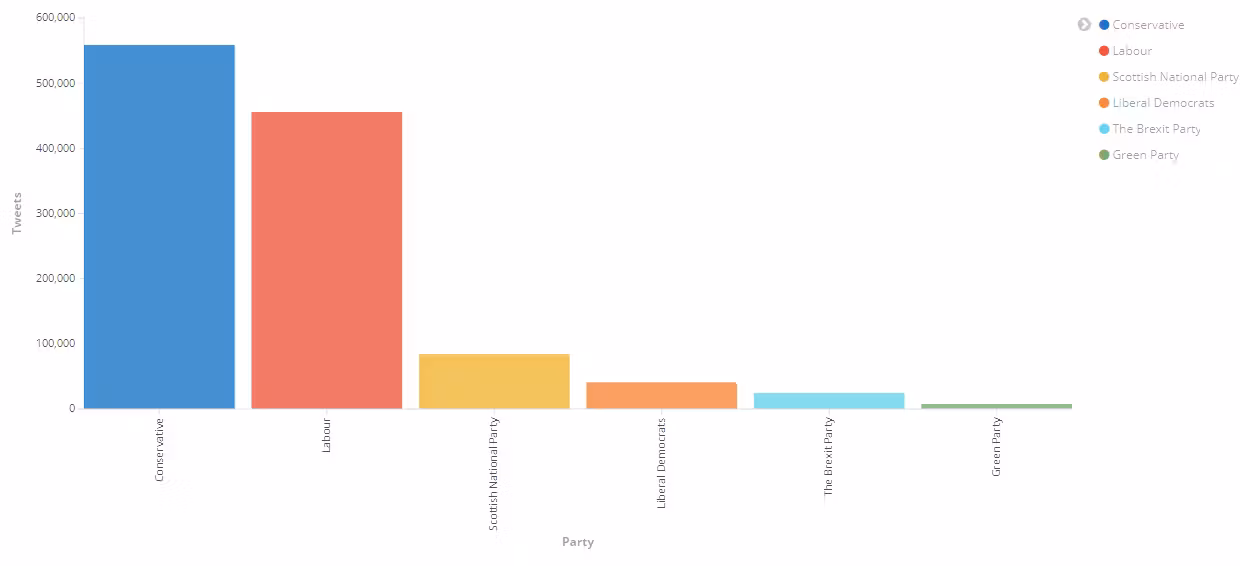
In the graph below, you’ll see how many tweets we discovered referencing each of the six major parties which we chose to look at. In terms of volume of tweets, the Conservatives came out on top, with Labour a close second.
In a general election, it’s obviously quite important for parties to quantify their popularity. However, what’s perhaps more important is understanding the seats in which they are popular – or not so popular. Whilst compiling a list of parliamentary constituencies is easy, linking those to Twitter users is definitely not – especially given that tweet geolocations are disabled by default. Fortunately, Twitter does provide users with a profile location field (which is generally well populated). However, very few people would choose to describe their location as their constituency. For example, I live in the Blackley and Broughton constituency, but I would describe my location as “Manchester”. Of course, the word “Manchester” still carries enough information for me to make a guess as to likely constituencies – this is where the InsightMaker Data Science API can help us!
Applying Data Science to identify constituencies
The InsightMaker Data Science API allows me to read information from InsightMaker natively into the Python scripting language – an ideal environment to apply our data science techniques.
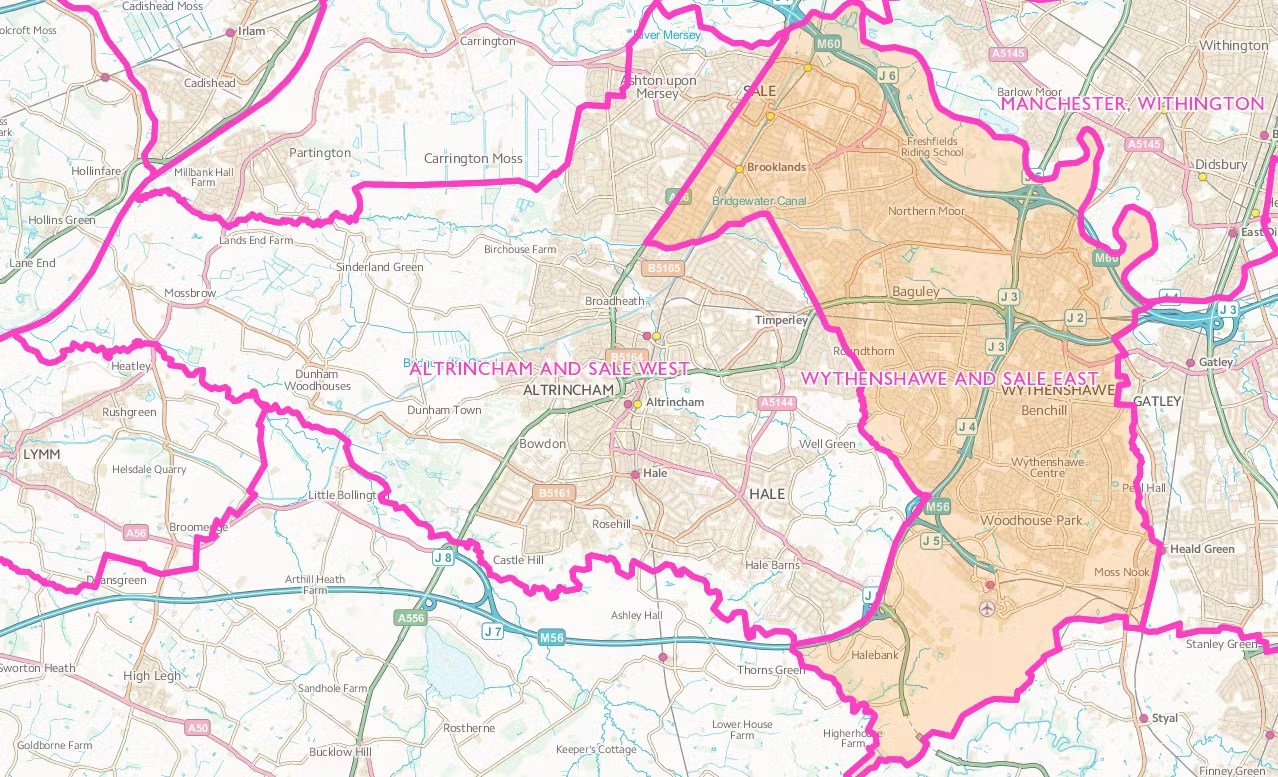
To solve the problem of identifying Twitter users’ constituencies, I first loaded a list of all UK constituencies into InsightMaker. Alongside this, I loaded their local areas, regions and countries. This collection of words for each constituency covers most of the ways in which their locations can be described. Obviously, some words are going to prove more useful than others. For example, lots of constituencies feature the words “north”, “south”, “east” or “west”. To measure the significance of a word, I used a technique similar to tf-idf (Term frequency–inverse document frequency) to weight words, giving those that appeared in less constituencies more weight. For example, two adjacent constituencies in Greater Manchester are “Altrincham and Sale West” and “Wythenshawe and Sale East”. If a user identified as being from “Sale”, we would struggle to differentiate between these two locations. However, if they set their location to “Altrincham” or “Wythenshawe”, we could be certain which constituency they were in as these words are unique to those constituencies. Hence, the less common words, “Altrincham” and “Wythenshawe” should be weighted higher than “Sale”.
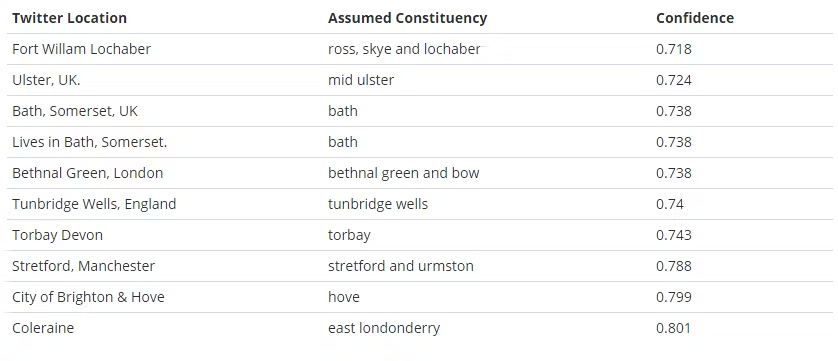
Using these weights, I can calculate the cosine similarity between users’ supplied locations and the names of all possible parliamentary constituencies. We then take a set of all matches at a determined threshold below the top match. By tuning this threshold, we were able to configure the model to match multiple possible constituencies, if the user specified an area larger than just one. For example, a location of “London” would return all London constituencies. However, if a user is more precise in the location they provide, such as “Battersea, London” then only the Battersea constituency would be returned.
The final statistical model can be configured as an InsightMaker enrichment step to tag possible constituencies and give an associated confidence level (derived from the similarity score) to every tweet. See below:
Now, we’ve got a pretty good picture of the volume of tweets relating to each of the six parts and their locations.
Modelling – Who was more popular on Twitter? Labour or Conservative?
More generally, any kind of model or preprocessing can be configured as an InsightMaker enrichment step. One model which can be particularly powerful for Twitter data is sentiment analysis. For convenience, I use a pre-trained model, TextBlob. Whilst many sentiment analysis models can struggle with social media data, we should still be able to derive some useful insights when aggregating tweets. I also like TextBlob as it allows us to measure both sentiment polarity and objectivity. Less objective sentences act as a better indicator of an author’s true sentiment!
Combining this with party and constituency information, we can start making some interesting visuals and conclusions. The most apparent of these (especially in retrospect!) is that Twitter has a sentiment bias towards the Labour party – this makes sense given the younger demographic of Twitter users.
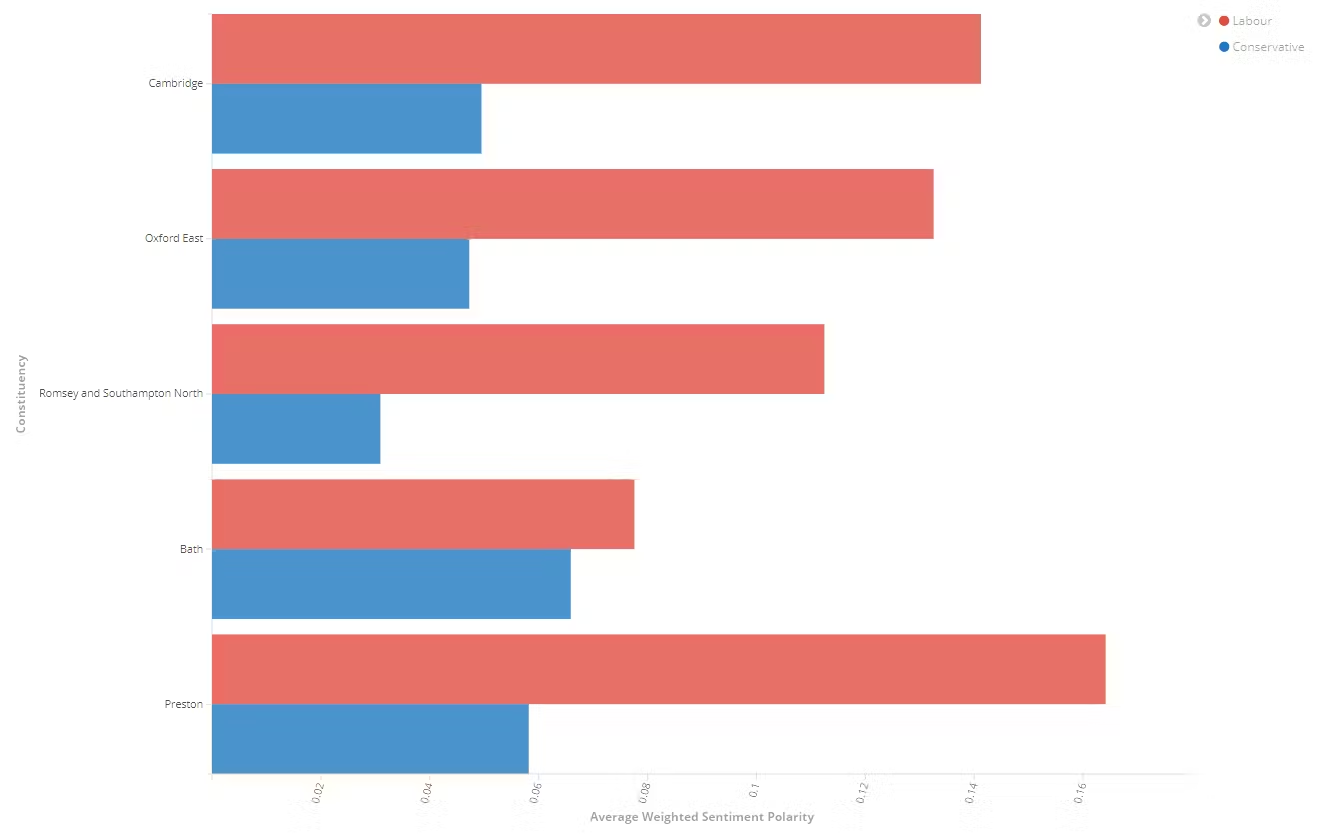
The chart below highlights the sentiment polarity for Tweets related to the Labour and Conservative parties across five constituencies.
Insights – How did Twitter compare to traditional news?
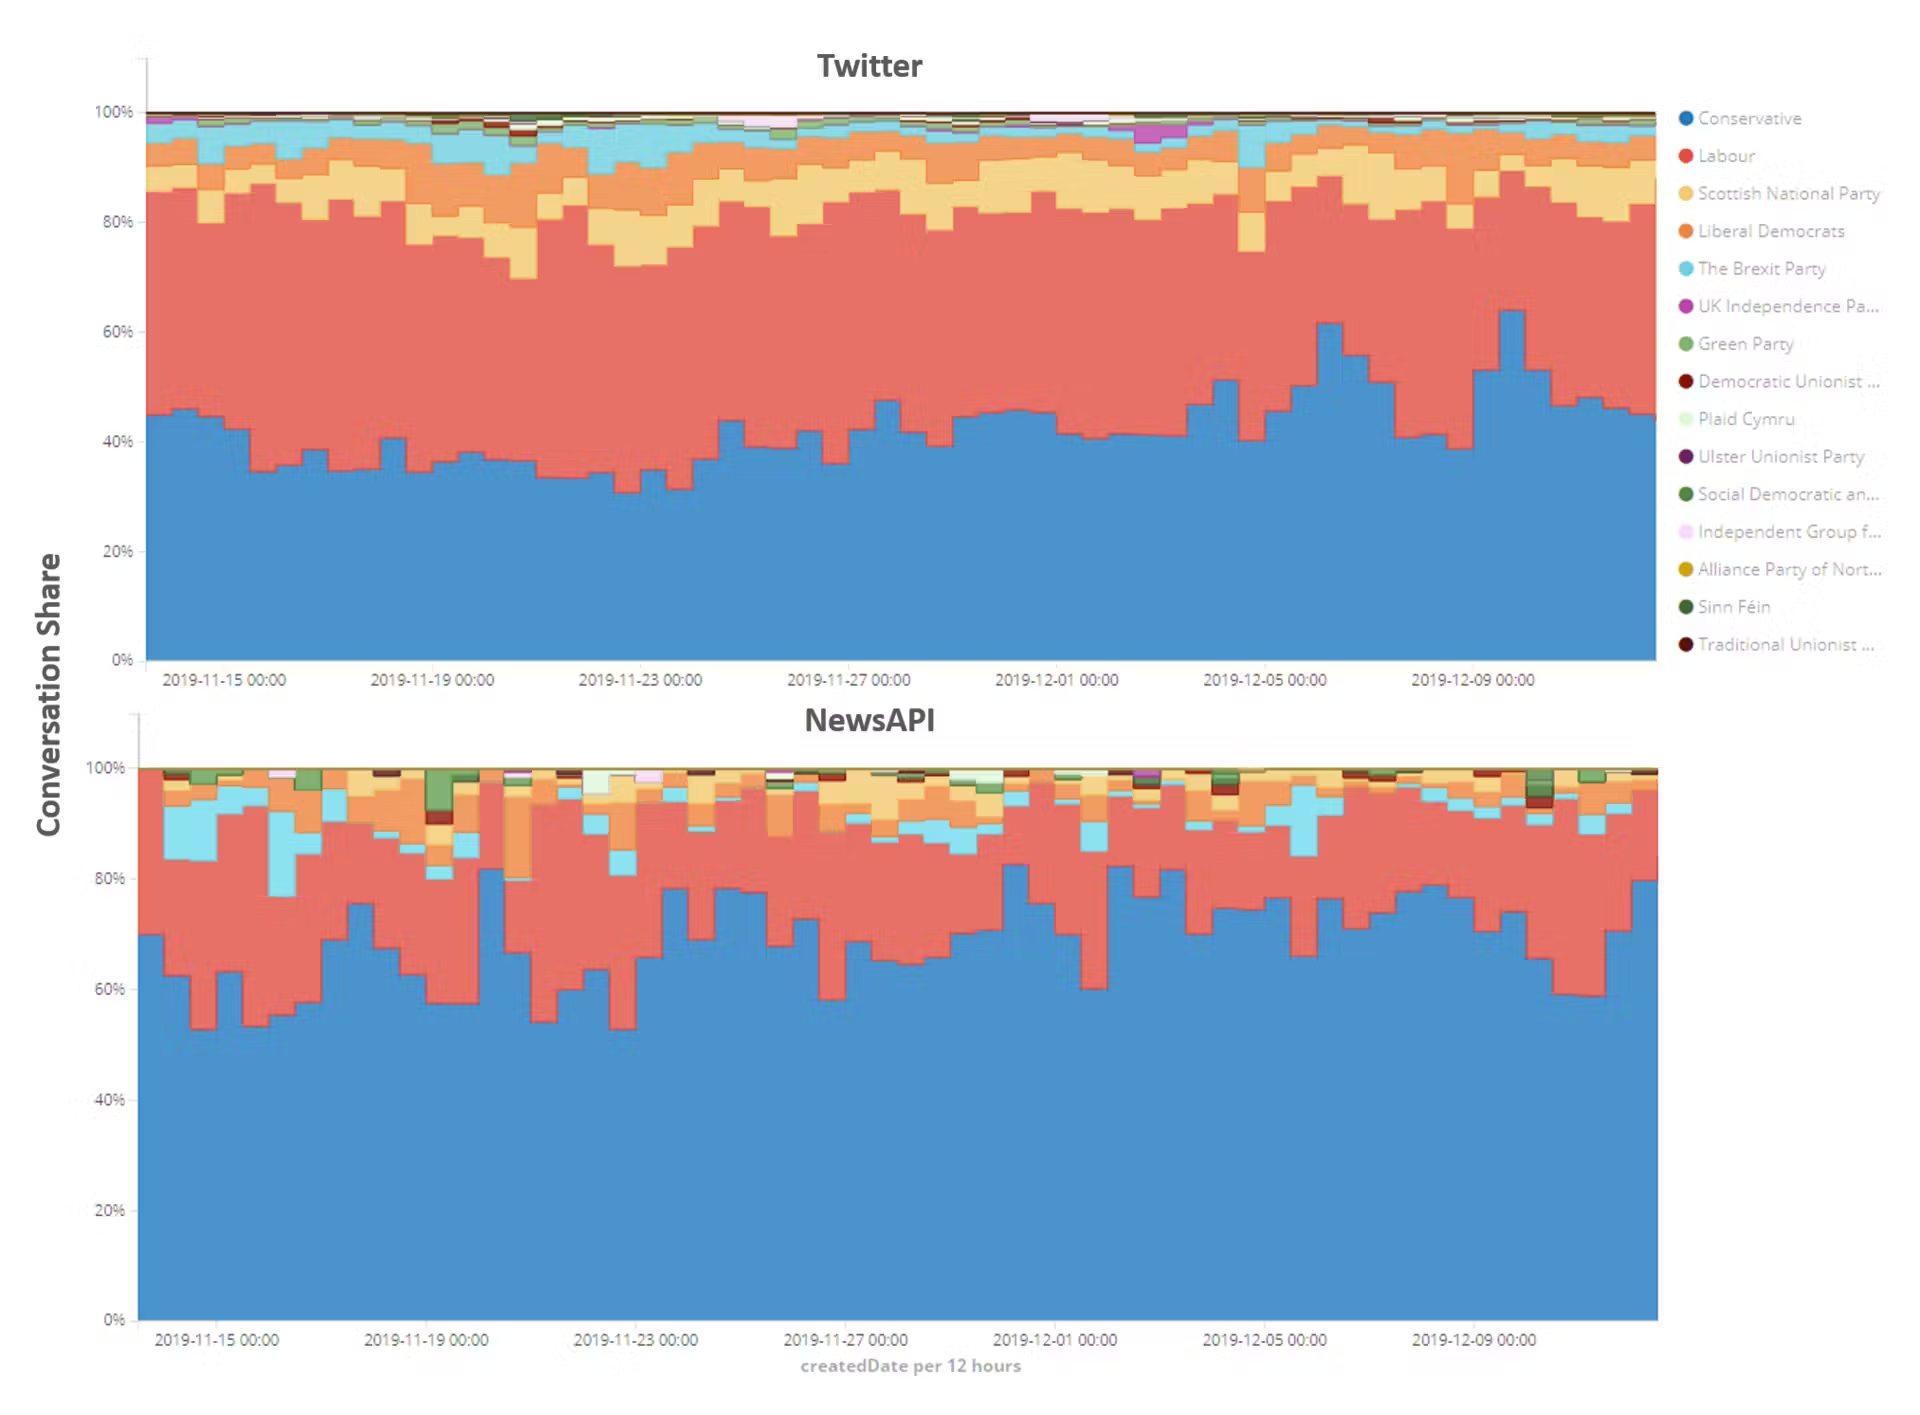
The bias we’ve seen towards Labour on Twitter is even more pronounced when we compare it to Labour’s conversation share in traditional news outlets (courtesy of newsapi.org).
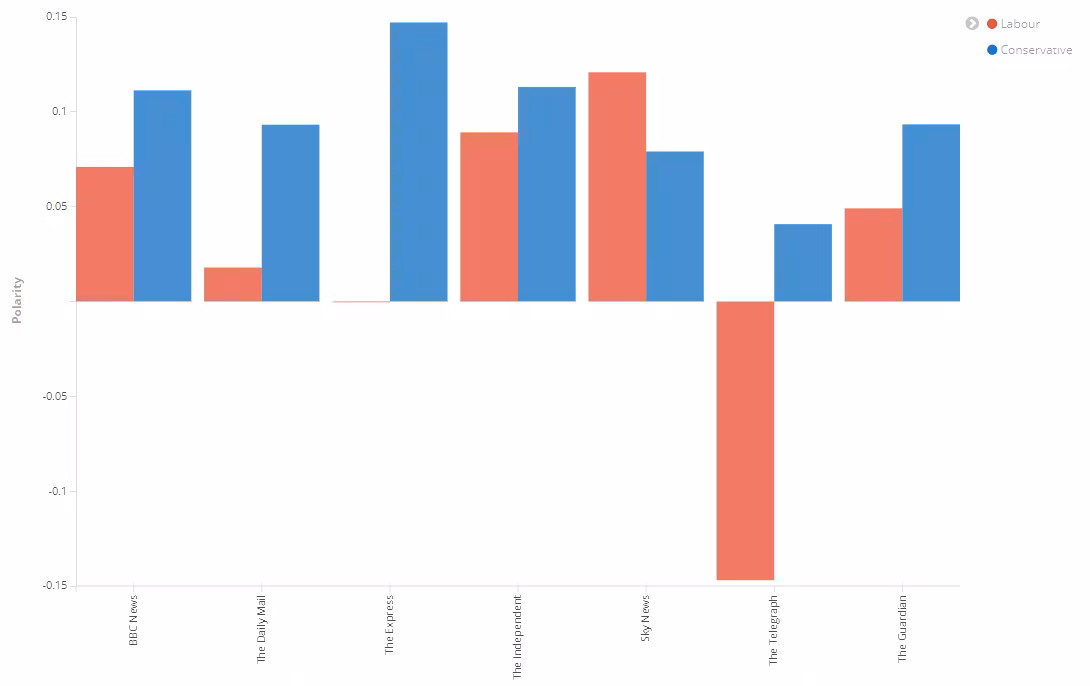
In the two charts below, we can see the contrast between conversation share for the two main parties – Labour and Conservative. By running the same sentiment analysis on news articles (broken down by publication) as we did for Tweets, it’s clear that the news is not without its biases either.
In the chart below, the difference in coverage volume for Labour and Conservative within traditional news outlets (quite literally) speaks volumes!
Insights – After the election
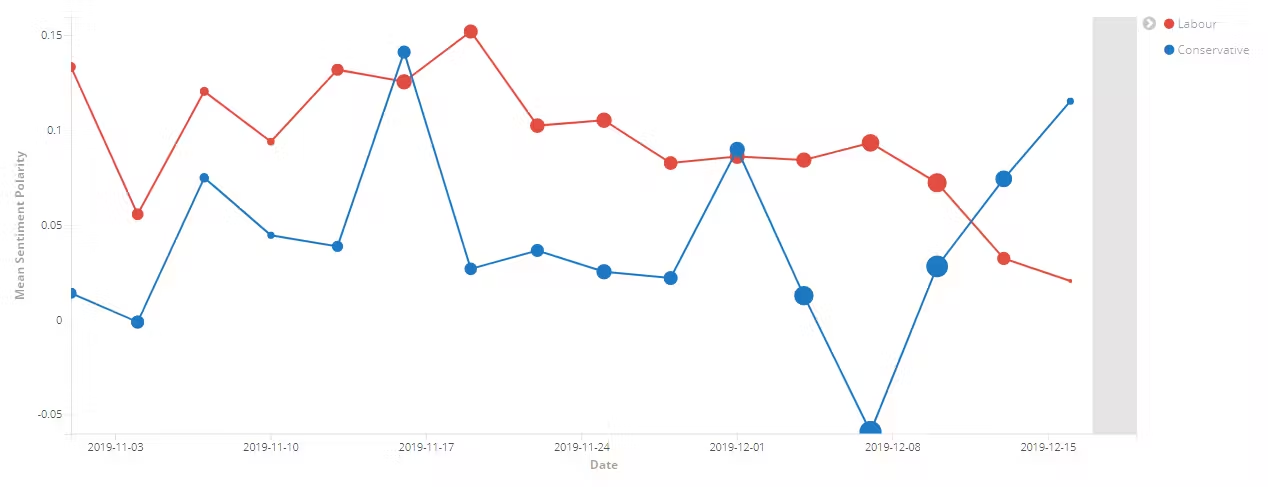
Whilst the apparent Twitter bias towards Labour did seem to endure throughout the election campaign, it seems the Labour support is now quickly dropping off after the Conservative victory. In the sentiment polarity timeline shown below, we can see the decline in the bias of Tweets towards Labour, compared to the sharp rise for Conversation. It looks like only now the Conservative party enjoys a significant lead in the Twitter opinion polls.
The Aiimi Data Science team thoroughly enjoyed applying these techniques to analyse just a fraction of the huge swathes of data surrounding the 2019 UK General Election. I hope it shows the scope for using data in this way to look at all sorts of other events and topics!
I’m also interested to hear from you – were you expecting the results you’ve read about today? Have you experienced first-hand any of the biases we’ve highlighted from traditional news outlets or as a Twitter user? Perhaps you have a suggestion for another event you’d like to see us analyse? Just let us know on Twitter or drop me an email at jlawton@aiimi.com
Stay in the know with updates, articles, and events from Aiimi.
Discover more from Aiimi - we’ll keep you updated with our latest thought leadership, product news, and research reports, direct to your inbox.
You may unsubscribe from these communications at any time. For information about our commitment to protecting your information, please review our Privacy Policy.
Book a demo
Curious about what the Aiimi platform can do for your organisation? Talk to our team or book a demo to find out how we can help.
Get in touch