2020 grading algorithm: understanding what went wrong
For the first blog in a new series that explores the ethics of AI and data science, Aiimi data scientists James Robinson and Reece Cook unpick the issues faced by Ofqual in allocating 2020 grades in a statistically sound way and assess the sources of potential bias.
Due to Covid-19, a whole cohort of Year 11 and Year 13 students faced the initially desirable problem of the 2020 GCSE and A-Level exams being cancelled. This initial freedom was soon replaced with widespread issues and protests, following the government's announcement that an algorithm would be used to replicate the exams. This algorithm looked to use each school’s historical results, teachers’ ranking of students, and predicted grades to allocate the students’ final grades. The decision to allocate grades for the cohort rather than the individual was crucial and allowed bias to creep in later. The approach was widely regarded as a failure, initially in Scotland and then in England a week later. [1]
One of the largest outcries stemmed from the perception that students from less economically privileged backgrounds were treated more unfairly by the algorithm. This sort of economic bias would have far-reaching consequences and cause long-term ramifications for the individuals affected.
Standardisation reports were provided to the schools and an Ofqual technical report was published in an attempt for transparency. [2] These standardisation reports showed the historic results for the school between 2017 and 2019 and provided a Prior Attainment Adjustment (PAA), which specified an adjusted percentage based on factors introduced to the algorithm. Both attempted to look at historical results as well as the expected difference between the new cohort and history. From a naïve Data Science view, this is not necessarily an issue as an aggregated approach. On average, past performance is often representative of future performance and an adjustment factor to accommodate what’s changed should allow for this to be accurate.
Yet through research, a few sources of potential bias have been identified:
The aggregated approach itself
Disparity between school and cohort
Class size
Teacher bias
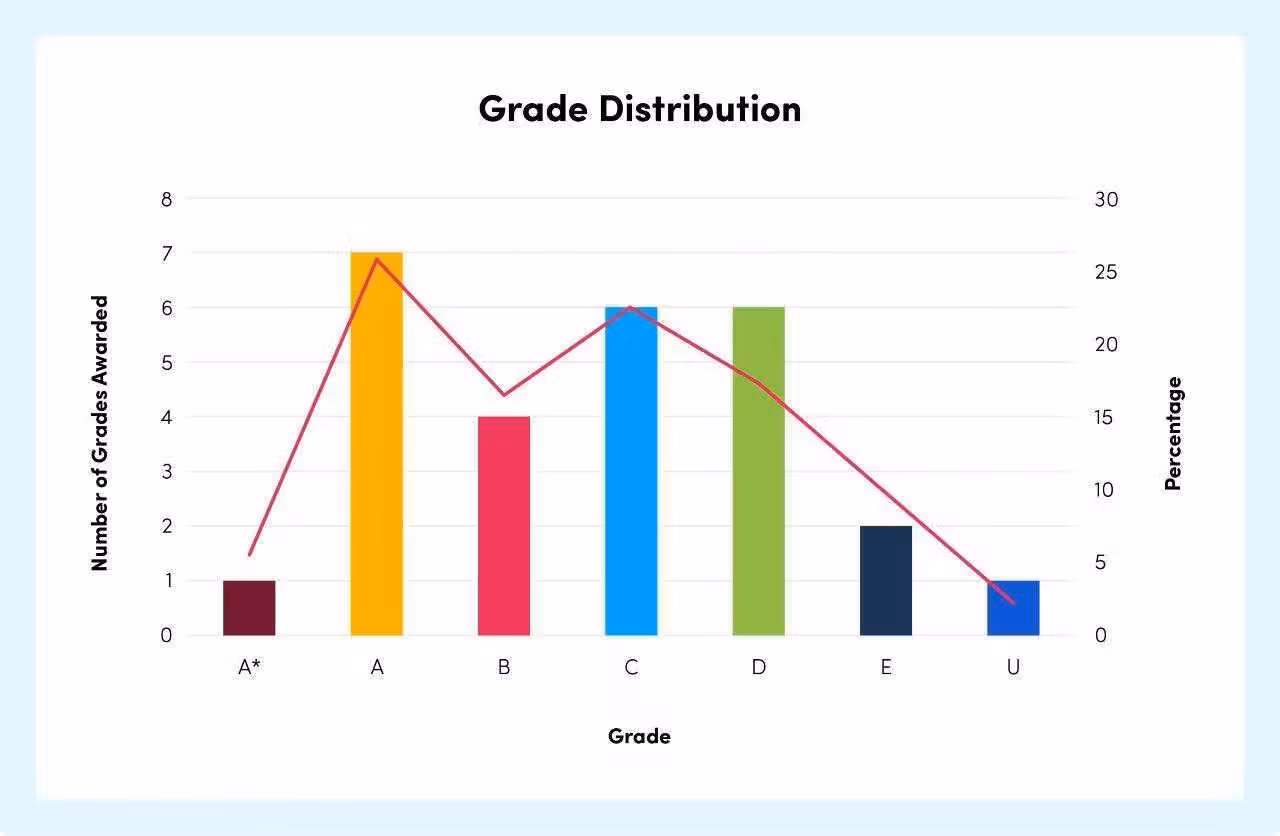
In the approach taken, the entire class is assessed as a whole, and grades are picked from the adjusted distribution. Simplifying slightly, the highest student within the teachers’ ranking is assigned the highest of the allocated grades and so on. But another issue is that the model predicts the grade proportions on a continuous scale. This then has to be rounded to fit the discrete number of pupils in the class, meaning another decision had to be made. For example: in a class of 27, if the model suggests that 5.7% of the class should be awarded an A* grade, should one student (3.7%) or two students (7.4%) receive an A*? A decision was made to round down for the higher grades, leading to many lowered grades. This is visualised below, with the model allocation being the red line and the actual assigned grades being the bars.

While this is unfortunate for the individual and a contributing factor to the method’s failure, the decision to round down is not a source of discriminatory bias. Nevertheless, it was another blow for students, and something that was only introduced by the decision to assign grades to the cohort as a whole. That said, bias was allowed to creep in during the PAA process.
As part of the PAA, Ofqual looked at a school’s historic performance and compared it to the expected performance of this year’s cohort. This works well when the two correlate closely, i.e. an average school with an average-performing cohort, or a good school with a high-performing cohort. But this fails, even at an aggregate level, when we have a poor school with a high-performing cohort. A large delta between predicted and historical achievements causes the algorithm to inappropriately allocate a lower grade to some students. Students who were predicted mid-tier grades such as Bs and Cs were often not allocated these. This directly affects students who have worked hard at historically poor schools; where they would usually be able to excel in exams, instead they were artificially held down. [3]
This highlights the importance of having ‘a seat at the table’. A statistician from a similar background to these students would’ve been much more likely to spot the potential for this kind of bias. Our Aiimi colleague Tajhame Francis has written an excellent piece on this topic.
Another aspect that introduced bias was how the algorithm allocated grades depending on class size. The confidence in the algorithm to allocate grades decreased with class size, most likely due to the small sample size and an amplification of the rounding issue explained above. To combat this, teacher-predicted grades were combined with adjusted grades in classes with fewer than 15 pupils. In classes of fewer than five pupils, adjusted grades were discounted altogether and only teacher-predicted grades were used. Since nearly 40% of allocated grades were lower than the teacher-predicted grades, there was a sizeable advantage in being allocated teacher-predicted grades, which benefitted pupils in small cohorts. The average class size varies massively between different types of school, with students in independent schools more likely to have more weighting on their teacher-predicted grades, and sixth form/further education centres much less likely. [4]

This explains why students in independent schools performed disproportionately better than students from other types of education centre. It was a form of social-economic bias and a direct result of the decision to allocate results per cohort, not by individual.
Teachers’ personal unconscious biases, while not being the fault of the model, undoubtedly impacted on their students’ results. With each teacher effectively having to rank the students in each of their classes, it is certain that unconscious bias would have affected the grades, unless a very deliberate effort was made to lessen the impact. At Aiimi, we are working to become more aware of our individual unconscious biases by running internal workshops and encouraging everyone to take the Harvard Implicit Association Tests.
The final mistake was the way in which the highest-performing model was selected. The unprecedented nature of the problem meant that the key factor in the algorithm (teachers’ ranking of students) was not available for previous years. This made it tricky to assess model performance. To overcome this, a decision was made to test the models based on actual rankings from 2019. Using actual rankings to predict actual grades is a key machine learning mistake, as the actual rankings should be highly correlated to the actual grades but are, crucially, unknown at the time of prediction. This would therefore give a false indication of model performance when it came to the 2020 cohort, meaning that the best model might not have been used. The reliance on teachers’ rankings within the cohort is also another result of modelling the cohort. [5]
This combination of factors had a huge effect on the grades allocated. Nearly 40% of awarded grades were lower than predicted grades [6] and, in some cases, three grades lower. This is the difference between a student being predicted an A grade by their teacher then being allocated a D grade by an algorithm. For individuals, this meant potentially missing out on university placements or job offers, not to mention a huge amount of stress.

With such a major impact on individual lives, this leads to the question of whether it is ethical to use an algorithm for this purpose. Ethics in AI is something that Aiimi is passionate about. We have established our own ‘AI for Good’ committee and are committed to taking accountability for how we use data and guiding our customers to use AI ethically.
An algorithm focused on assigning grades to individual students rather than cohorts could remove many of the biases mentioned, as well as being fairer on the individual. It would also mean that many more factors could be taken into account in the model, such as the student’s own GCSE grades, mock results, and predicted grades, as well as the accuracy of the teachers’ predictions.
The government ultimately reverted to using teacher-predicted grades for the 2020 cohort. While many believe this was the right thing to do, the cost of not having a better algorithm may now be felt by next year’s students. With students being awarded the higher of their predicted or awarded grades and many wanting to defer university places until next year, it will be much tougher for students sitting their exams in 2021. This shows the importance of getting it right first time. If the method for calculating grades had been published after predictions were submitted, there would been plenty of time to receive feedback from a wide variety of sources and implement any improvements, which could have helped get it right for the 2020 cohort.
This was, unquestionably, a difficult task, with many complexities and a huge number of edge cases. We do not envy Ofqual for having to come up with grades for several hundred thousand students. A genuine attempt was made to ensure that the chosen method did not display some biases on an aggregate level, but ultimately this was not good enough. The decision to assign grades to cohorts was the source of multiple forms of bias, while also being potentially less ethical than modelling each student individually.
So far, the government seems keen to avoid this process altogether next year, saying that the 2021 exams will go ahead, underpinned by contingency measures. Wales recently announced that its 2021 exams will be cancelled, with teacher-managed assessments and coursework to form the basis of ‘centre-based outcomes underpinned by a model of external verification’. Scotland has made a similar decision about its National 5 exams.
Hopefully having more time to prepare these and any other contingency measures will ensure fairer outcomes next summer. Because one thing is certain – the lessons learnt this year demonstrate the importance of taking the care required to avoid potential biases and ethical issues, and this should be at the forefront of any future statistical modelling considerations.
Sources referenced in this article:
[1] https://www.bbc.co.uk/news/edu...
[2] https://assets.publishing.serv...
[3] http://thaines.com/content/ALe...
[4] https://ffteducationdatalab.or...
[5] http://thaines.com/post/alevel...
[6] https://www.bbc.co.uk/news/edu...
Stay in the know with updates, articles, and events from Aiimi.
Discover more from Aiimi - we’ll keep you updated with our latest thought leadership, product news, and research reports, direct to your inbox.
You may unsubscribe from these communications at any time. For information about our commitment to protecting your information, please review our Privacy Policy.